INDEX™23 Figures
INDEX™23 SURVEY SUMMARY
We are pleased to provide below some selected results and analyses resulting from the exhibitor and visitor satisfaction surveys. Immediately following INDEX™23, an independent market research company sent out on-line questionnaires to both exhibitors and visitors who participated in INDEX™23 between 18 and 21 April 2023.
The objective was to identify reasons for attending INDEX™23 and assess the corresponding levels of satisfaction with the event amongst its key target audiences. In this manner, we sought to reveal valuable feedback, thus ensuring that future editions continue to address the wants, needs and concerns of the truly ingenious industry it serves.
In this report, the information provided by the research was complemented by registration data entered by visitors when registering for the on-site event.
We trust that you will find it interesting and thought-provoking!
The INDEX™ Team
INDEX™23 exhibition took place for the 14th consecutive time in Geneva and brought together 610 exhibitors from 42 countries, and a total 12’017 entries from over 100 countries.
EXHIBITORS
EXHIBITORS PROFILE
The INDEX™23 edition was marked by a high level of enthusiasm, the vigorous activity on the exhibition floor bearing witness to the attendees’ determination to make the most of this unique business opportunity. The total number of exhibitors present at the event indicates the return of the trend towards increased participation of nonwovens companies and their suppliers observed before the pandemic. The graph below shows comparative figures for exhibitor numbers over the last five editions of the exhibition.
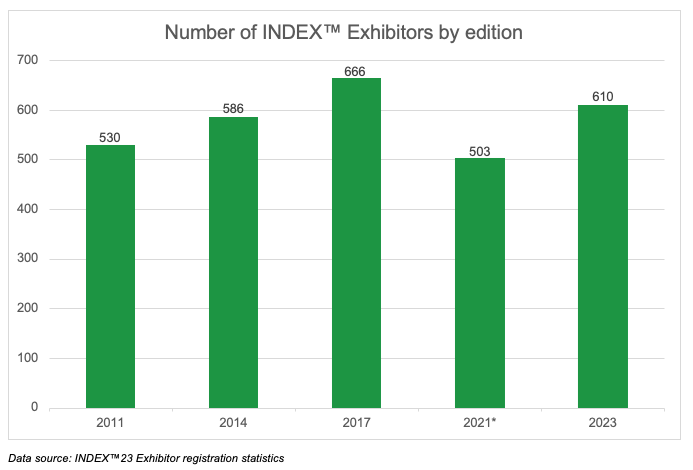
* INDEX™20 took place in October 2021 at the beginning of the recovery from the global pandemic and, therefore, the figures are below the usual trend towards increasing exhibitor numbers.
Geographical origin of exhibitors
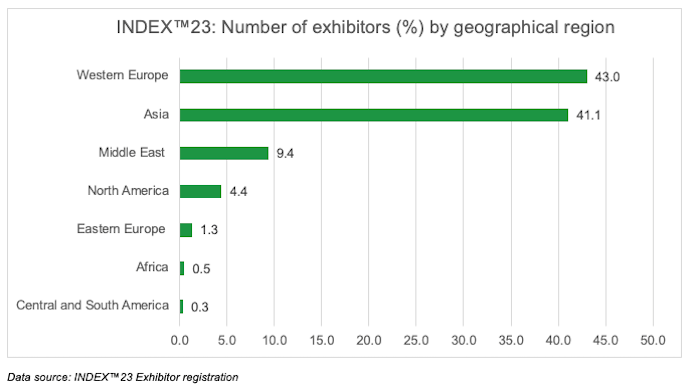
Reflecting the global evolution of the nonwovens market, the number of countries of origin remained similar to editions prior to INDEX™20 (in 2021) during which most Asian companies were not able to attend due to travel restrictions.
Exhibitors from Western Europe were once again in the majority at INDEX™23, accounting for 43% of total exhibitors, compared to 59.8% in 2021, largely explained by the absence of Asian exhibitors onsite, and to 49.5% in 2017.
The following table shows the percentage of exhibitor numbers by geographical region for INDEX™23.
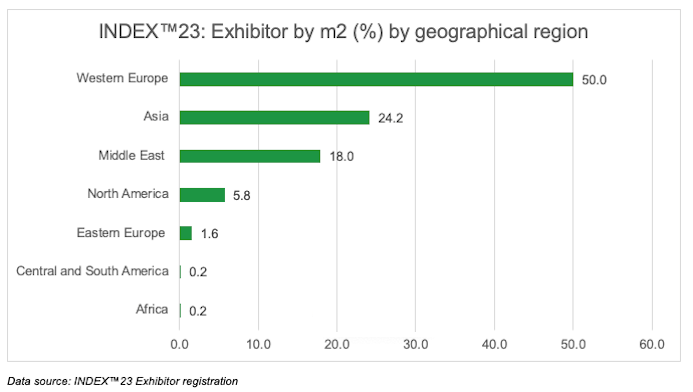
The following chart shows the percentage of rented square meters by exhibitors in terms of geographical region for INDEX™23.
Please note that, different sources may define regions differently (and thus countries included within them), that the definition is often linked with different cultural constructs about geography and cultural affiliation - amongst other factors - we have opted for the most frequently-cited classification in encyclopedias and main global population data sources.
In 2023, in terms of square meters of exhibition space occupied and by order of size, the top countries exhibiting were: Italy, Germany, Turkey, the People’s Republic of China, the United States, India, France.
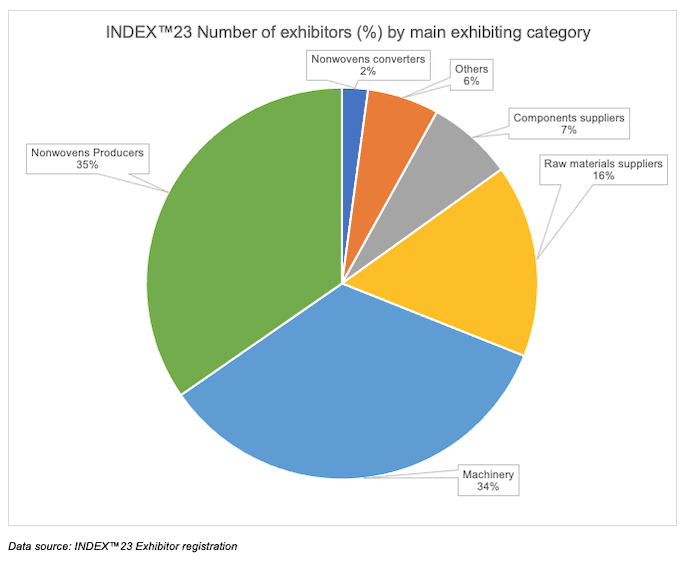
The pie chart below shows the percentage of INDEX™23 exhibitor numbers by main exhibiting category.
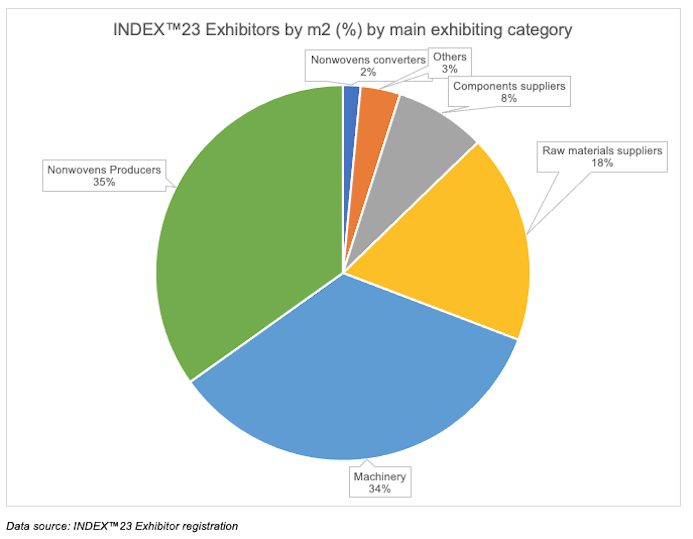
The trend is similar in terms of exhibitor square meters by main exhibiting category as shown in the chart below:
REASONS FOR EXHIBITING
The main reason for exhibiting at INDEX™23 and exhibitor satisfaction.
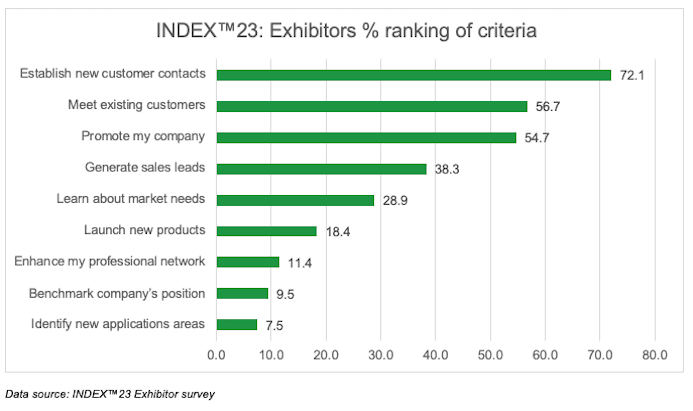
The bar chart below illustrates how exhibitors rank their principal reasons for exhibiting at INDEX™23 (from a given list).
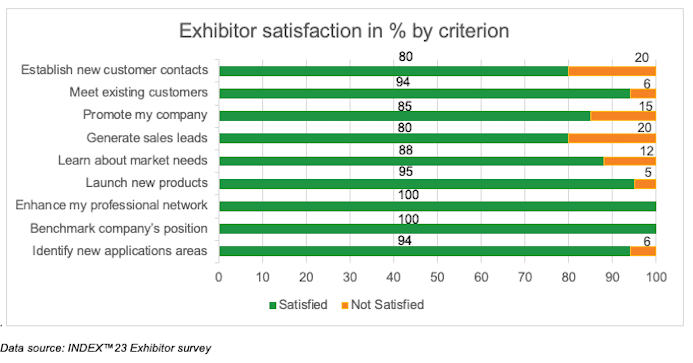
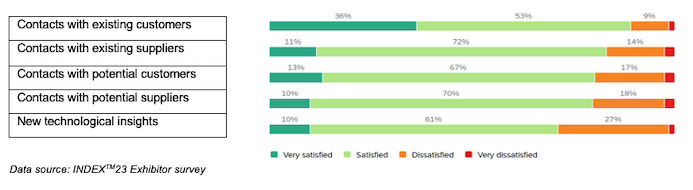
While the graphic below shows the level of satisfaction by each criterion:
SATISFACTION WITH THE EXHIBITION
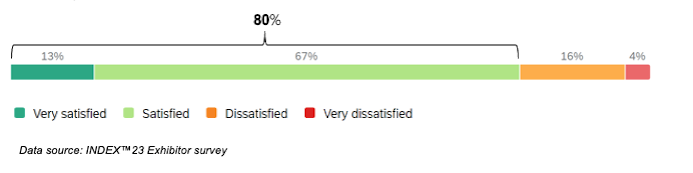
The overall satisfaction with the INDEX™23 exhibition is shown in the bar graph below:

A slight decrease in the overall satisfaction with the exhibition was observed in comparison to the 2021 edition (92%), mostly explained by the exhibition dates coinciding with the period of Ramadan which prevented exhibitors from certain regions from bringing a full complement of staff and from meeting clients from certain regions unable to attend the exhibition because of the dates.
INDEX™23 Exhibitors’ satisfaction with Business Impact
How satisfied were exhibitors at INDEX™23 with the main aspects related to ‘Business Impact”?
In the following table, the main aspects for evaluating the business results and their corresponding level of satisfaction:
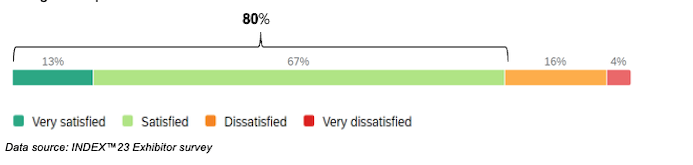
The following chart illustrates exhibitors’ overall satisfaction with the business impact achieved through their presence at INDEX™23:
INDEX™23 Exhibitors’ Overall Satisfaction with Visitors
The overall exhibitor satisfaction with the visitors they encountered at INDEX™23 is reflected in the following chart.
VISITORS
VISITORS PROFILE
INDEX™23 recorded a stunning 12’017 entries on-site. Once again, the entire nonwovens industry worldwide was widely represented at this leading event with the presence of visitors from 103 nations. The last INDEX™ edition in 2021, which was much affected by the COVID 19 crisis, recorded 9’300 entries. At INDEX™23 this inspiring visitor figure returns attendance to levels similar to those seen in editions prior to the global pandemic, highlighting not only the resilience of the market but also the unique role which INDEX™ fulfills in representing this dynamic and innovative industry.
The following results explore in further detail exactly who these visitors were, what they were seeking at INDEX™23, and the extent to which the event satisfied (or not) their expectations.
Geographical origin of visitors
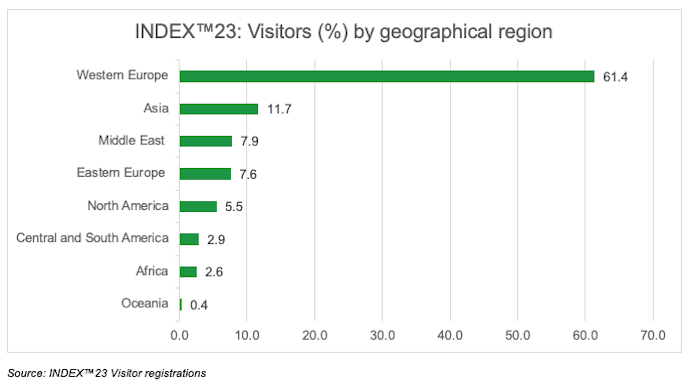
The most represented geographical areas in terms of visitors follow a similar pattern to those observed in the exhibitor statistics.
Whilst in 2021, Eastern Europe was the second largest area represented (8.8%), the second position is now occupied by visitors from the broader Asian region. The representation of Asian attendees is mainly explained by the return to a more stable situation following years of lock-down (Covid pandemic situation).
Eastern Europe is now classified in 4th position, down from 2nd place in 2021, probably due to the dual influences of a lack of Asian competition in 2021, and also the geopolitical situation linked to the war in Ukraine in 2023.
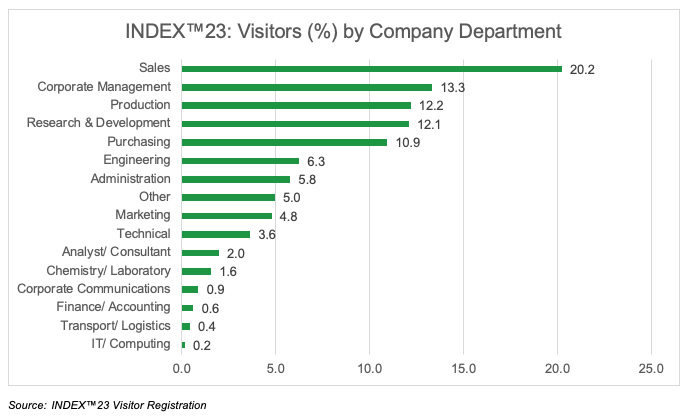
Visitors by Company Department
When examining the Company Department in which visitors were employed, Sales, Corporate Management, Production, Research & Development, and Purchasing are amongst the most frequently-quoted company departments.
Visitors by Company’s Sector of Interest
The principal industry sectors served by the companies in which INDEX™23 visitors were employed were : Hygiene (46%), Wipes (36%), Medical / Surgical (27%), Packaging (23%) and Automotive excl. carpets (18%).
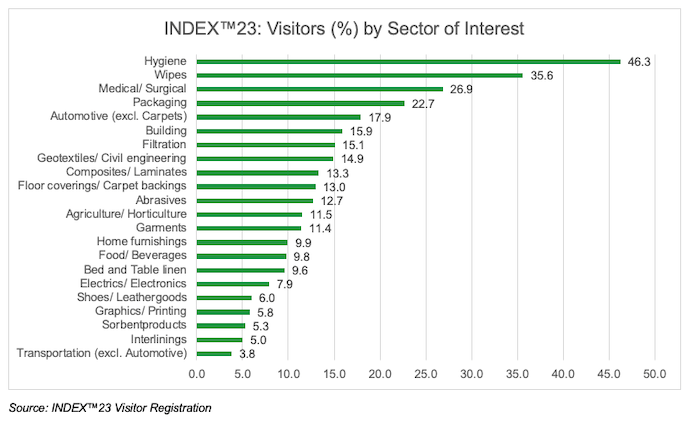
(n.b. Multiple choice possible, therefore total does not equal 100%)
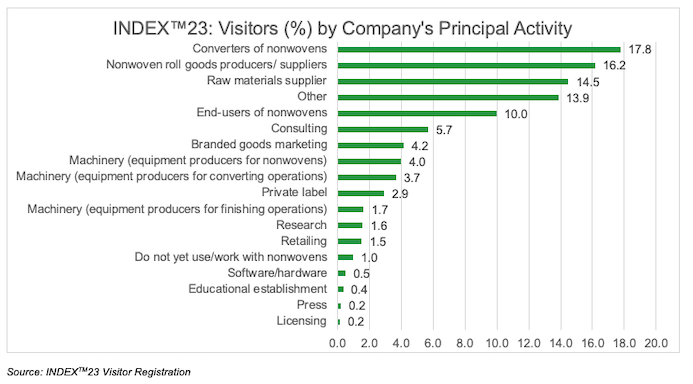
Visitors Companies - Main Activity
The principal sectors of activity of companies represented by visitors to INDEX™ were nonwovens converters, nonwoven roll goods producers/ suppliers, raw materials suppliers, and end-users of nonwovens, amongst several others as indicated in the chart below:
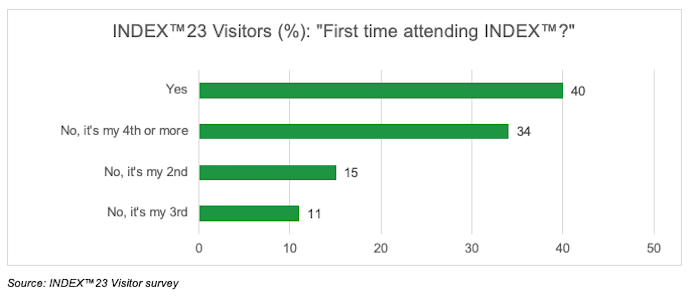
Frequency of visiting INDEX™
To the question: “Is it your first visit to INDEX™?”, 40% of visitors replied in the affirmative. Therefore, visitors that had previously visited INDEX™, all frequencies together, represented a total of 60% of visitors.
In 2021, more than half of all visitors (54%) answered that they were first-time visitors.
The figure in 2023 with fewer first-time visitors can perhaps be explained by the shorter interval between the INDEX™20 (October 2021) and INDEX™23 (April 2023) editions, possibly resulting in a reduction of the habitual job turnover or change in position between events, enabling industry participants to attend more than once during their time in the role.
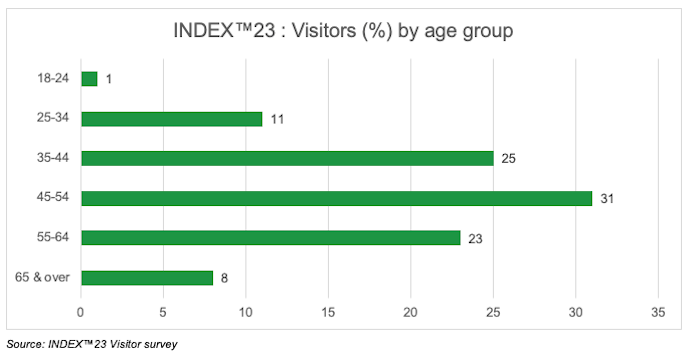
Visitors by age group
The chart below demonstrates that the largest age group, accounting for 31% of the visitors, was the 45-54 year-olds. The next most populated age group, accounting for 25% of visitors, was the 35-44, age group. Following this sector was the 55-64 age group, with 23% of the visitors. The youngest visitor age group, combining the 18-24 year-olds and the 25-34’s represented 12% of our total visitors.
REASONS FOR ATTENDING
The main motivations for attending the event remained stable when compared to previous editions. “Meet new suppliers”, “Discover new product ideas”, “Learn about market trends”, “Meet current suppliers” and “Meet customers”, were selected as some of the most important reasons for attending.
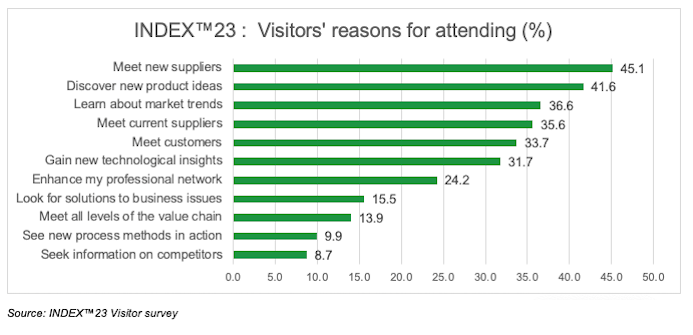
(n.b. Multiple choice possible, therefore total does not equal 100%)
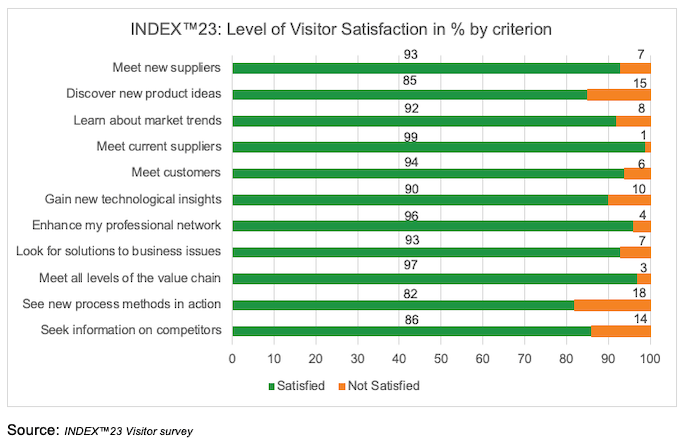
VISITOR SATISFACTION
The chart below shows visitors’ satisfaction levels on a number of selected criteria.
Despite some dissatisfaction amongst exhibitors’ (c.f. above) regarding the number of visitors seeking new suppliers, 93% of visitors themselves were satisfied with the opportunities provided to meet new suppliers at INDEX™23.
Importantly, the satisfaction levels on both a personal (“Enhance my professional network”: 96%) and business criteria (“Meet current suppliers”: 99%; “Meet all levels of the value chain”: 97%; “Look for solutions to business issues”: 93%) were extremely high for a large % of the visitors attending, showing the enormous perceived value of participating at INDEX™23.
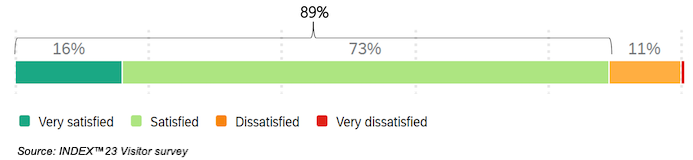
VISITOR SATISFACTION WITH BUSINESS VALUE
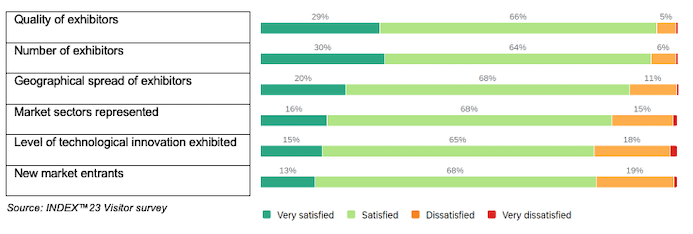
As shown in the graphic below, the level of visitor satisfaction with the exhibition overall totaled 89%, if both the ‘very satisfied’ and ‘satisfied’ answers are combined. If the answers to this question are broken down further (see below), the factor which met with the greatest level of satisfaction amongst visitors was the “Quality of exhibitors”, with 95% of all respondents expressing their satisfaction.
Visitor satisfaction with business value
Visitor Satisfaction by Criteria
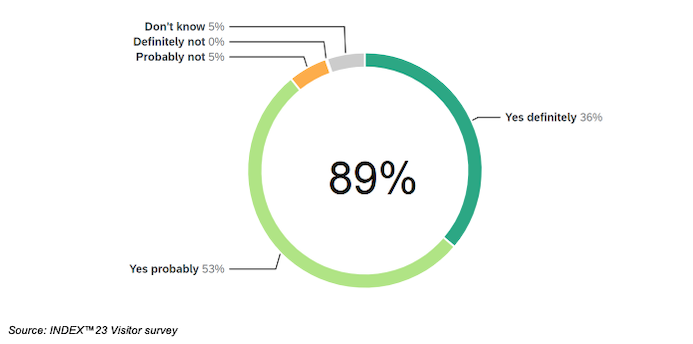
Intention to visit INDEX™26
When questioned regarding their intention to visit the next exhibition, 89% of the respondents to the visitor survey replied positively (‘Yes definitely’ + ‘Yes probably’), as shown in the chart below.
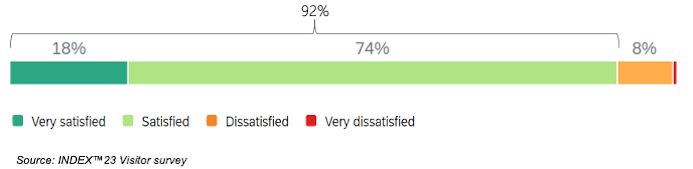
VISITOR OVERALL SATISFACTION WITH THE EXHIBITION
Considering all aspects assessed in this questionnaire, 92% of the visitors were “very satisfied” or “satisfied” with the quality of INDEX™23.
Visitor overall satisfaction
In summary, the data reveals both the global reach of the nonwovens industry and also the industry’s validation of the prominent role played by INDEX™, as a worldwide reflection of the present and the future of a diverse and powerful industry.
FURTHER INFORMATION
The next edition of the event, INDEX™26, will take place at Palexpo in Geneva,
from 19 to 22 May 2026.
Contact
Magali Fakhry Dufresne
Exhibition Director
Palexpo SA
Route François Peyrot 30
1218 Le Grand Saconnex
Switzerland
Tel : +41 22 761 10 61
E-Mail : index@palexpo.ch
main media partners